Editor's Note: Take a look at our featured best practice, Cost Segregation Study: Multiple Property Class Analysis (Excel workbook). Accountants, accounting firms, and real estate property owners can all benefit from this cost segregation study (CSS) template. It makes the estimated benefit easy to figure out and has flexible assumptions for high level or detailed segregation analysis. You get a summary of cost [read more]
KPI Management: Business Growth KPIs
* * * *
 In business, growth is everything. To put it bluntly, if you’re not growing, you’re dying.
Thus, it’s critical leaders select appropriate Key Performance Indicators (KPIs) designed to translate growth efforts into measurable outcomes. For organizations across the spectrum, these metrics provide a lens through which growth can be assessed, strategies refined, and objectives recalibrated.
The purpose of this article is to explore the critical Business Growth Metrics that serve as signposts on the journey of sales growth and organizational maturity. We aim to shed light on how these KPIs can enhance decision-making processes, inform strategy formulation, and drive operational improvements. For leaders within any organization, these metrics offer the tools to steer their initiatives toward sustainable growth.
Importance of Business Growth Metrics
Business Growth Metrics are more than mere numbers–they are vital signs of an organization’s health and trajectory.
In the digital/data/AI era marked by competition and continuous change, the ability to measure growth accurately provides organizations with the strategic foresight needed to adapt and thrive. Whether it’s scaling operations, increasing market share, or enhancing service delivery, growth metrics offer the data-driven foundation for informed strategic planning.
Challenges to Defining and Managing Business Growth KPIs
Executives and senior managers across organizational models face the universal challenge of balancing resource allocation with growth aspirations. Identifying which growth metrics to track and interpreting them within the context of organizational goals can be daunting.
Additionally, ensuring that these metrics resonate with stakeholders’ expectations and the broader mission of the organization is a delicate task. The KPIs within the Business Growth Metrics group address these challenges by providing a comprehensive framework to gauge growth, optimize performance, and communicate progress effectively.
Top 10 Business Growth KPIs
In the pursuit of growth, organizations must zero in on the metrics that matter most. The following are the top 10 Business Growth KPIs universally acknowledged for their critical role in driving and measuring success across diverse organizational landscapes. These KPIs are selected from the Flevy KPI Library, a robust database of over 15,000+ KPIs.
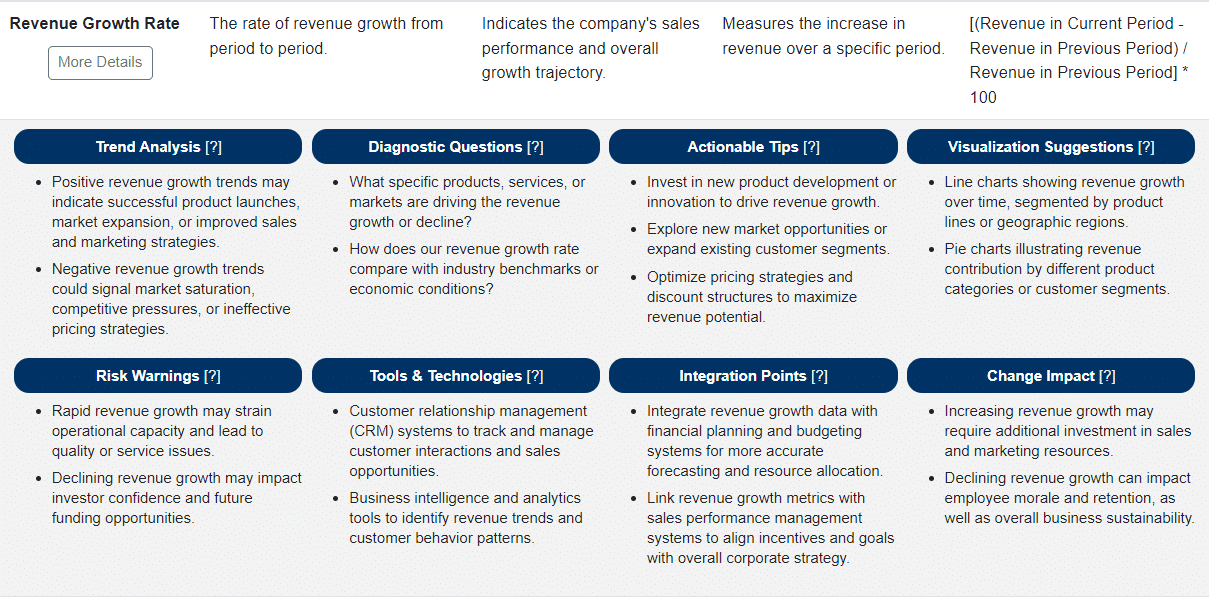
1. Revenue Growth Rate
- Definition: The percentage increase in an organization’s revenue over a specific period.
- Relevance: This KPI is fundamental to any growth analysis, indicating the overall health and trajectory of the organization. It reflects the success of sales and marketing efforts and is a key indicator of market demand and organizational expansion.
2. Gross Profit Margin
- Definition: The percentage of revenue that exceeds the cost of goods sold (COGS), indicating how efficiently an organization uses its resources.
- Relevance: Gross profit margin is critical for assessing an organization’s financial health and its ability to manage production costs while pricing its products or services competitively.
3. Customer Acquisition Cost (CAC)
- Definition: The cost associated with convincing a potential customer to buy a product or service, divided by the number of new customers acquired.
- Relevance: A low CAC relative to the value of the customer (Customer Lifetime Value) indicates a highly efficient and scalable business model, which is essential for growth.
4. Customer Retention Rate
- Definition: The percentage of customers that an organization retains over a given period.
- Relevance: This metric is vital for understanding customer satisfaction and loyalty, which are key drivers of sustainable growth.
5. Earnings Before Interest, Taxes, Depreciation, and Amortization (EBITDA) Margin
- Definition: A measure of an organization’s operating profitability as a percentage of its total revenue.
- Relevance: EBITDA margin is an indicator of an organization’s financial performance and its ability to generate cash flow for growth investments.
6. Net Promoter Score (NPS)
- Definition: A metric that measures customer experience and predicts business growth by gauging the likelihood of customers to recommend an organization to others.
- Relevance: High NPS is often correlated with stronger customer loyalty and can signal future growth through word-of-mouth.
7. Market Share
- Definition: The percentage of an industry’s sales that a particular organization controls.
- Relevance: Gaining market share is a clear sign of competitive advantage and growth within an industry, often leading to increased investor confidence.
8. Capital Investment Efficiency
- Definition: The return on investment for capital spent on growth initiatives.
- Relevance: This KPI is crucial for determining the effectiveness of capital allocation and is a strong indicator of strategic investment success.
9. Sales Qualified Leads (SQL)
- Definition: The number of potential customers that have been vetted by both marketing and sales teams as being ready for the next stage in the sales process.
- Relevance: A high number of SQLs suggests that an organization’s marketing efforts are effective, which is predictive of future sales and growth.
10. Return on Equity (ROE)
- Definition: A measure of the profitability of a business in relation to its equity, calculated as net income divided by shareholder’s equity.
- Relevance: ROE is an indicator of how effectively an organization is using its equity to generate profit and growth.
To dig deeper into any of these KPIs, we invite you to explore the Flevy KPI Library, which allows you to drill down into 12 attributes for each KPI in the database. Here is an example for our top ranked KPI, Revenue Growth Rate:
Case Studies and Success Stories
Accelerating Revenue Through Strategic Market Penetration
A mid-sized tech organization sought to increase its market share within a saturated industry. By focusing on the “Market Share” and “Revenue Growth Rate” KPIs, the organization aimed to identify opportunities for growth in untapped market segments.
The organization invested in comprehensive market analysis to refine its customer targeting and deployed aggressive marketing strategies tailored to the identified segments. They also leveraged customer feedback to improve product offerings, aligning them more closely with market needs.
Outcome: Within two fiscal years, the organization saw a 15% increase in market share and a corresponding 20% increase in its revenue growth rate. The alignment of product development with market demand was key to this success.
Lessons Learned: The importance of aligning product offerings with specific market needs and the effectiveness of targeted marketing strategies are underscored here. KPIs like market share and revenue growth rate are instrumental in measuring the impact of these strategies.
Optimizing Investment for Sustainable Growth
An international non-profit organization needed to improve its capital investment efficiency to ensure sustainable growth. Their goal was to maximize the impact of each dollar spent.
The organization revised its capital allocation strategy, focusing on projects with the potential for high ROE and significant contributions to EBITDA margin. They implemented a rigorous project evaluation framework to better forecast investment outcomes.
Outcome: This strategic shift resulted in a 30% improvement in capital investment efficiency, directly contributing to a 10% uplift in EBITDA margin, and a more robust ROE over the next three years.
Lessons Learned: Careful evaluation and selection of investment opportunities based on projected efficiency can significantly enhance an organization’s financial health and growth potential. The ROE and EBITDA margin are key indicators of the effectiveness of investment strategies.
Additional Resources and Further Reading
Foremost, if you are in the process of selecting or refreshing your Corporate Strategy KPIs, take a look at the Flevy KPI Library. With over 15,000+ KPIs, our KPI Library is one of the largest databases available. Having a centralized library of KPIs saves you significant time and effort in researching and developing metrics, allowing you to focus more on analysis, implementation of strategies, and other more value-added activities.
Here are other KPI Strategy and KPI Management articles we’ve published:
- Principles of KPI Selection. This article breaks down the 8 guiding principles to KPI selection and provides several case studies on how to use these principles in practice.
- Principles of KPI Maintenance. It’s important to recognize that as market conditions and strategic objectives evolve, so too must the KPIs. This article provides a disciplined approach to maintaining KPIs.
- KPI Dashboard Design & Visualization. Learn the art and science of designing KPI dashboards, including types of data visualization and how to choose among them.
- Anatomy of a Strong KPI. Learn what makes a KPI effective, discussing the characteristics of KPIs that are most impactful and how they can drive strategic business decisions.
- 10 Common Pitfalls in KPI Implementation. Learn how to identify and remediate the 10 most common pitfalls in KPI implementation. If left unfixed or as unknowns, these pitfalls can have disastrous, long-term impacts on the organization.
- KPIs and Organizational Alignment . This article discusses the concepts of strategic, tactical, and operational KPIs; as well as balancing individual, team, and organizational objectives.
- Integrating KPIs into Employee Performance. This article discusses 5 methods for integrating KPIs into individual performance metrics; and includes several case studies.
- Integrating KPIs into the Organizational Culture. This article breaks down 4 strategies for embedding KPIs into the Corporate Culture; also includes several case studies.
- Future-Proofing KPIs. Understand how to “future-proof” KPIs by understanding the impacts of emerging market trends, emerging technologies, and evolving consumer behaviors on KPIs.
- KPIs and Digital Transformation. All organizations are undergoing Digital Transformations. Learn how to define, select, and implement relevant Digital Transformation KPIs.

103-slide PowerPoint presentation
Recent McKinsey research surveyed a large set of global executives and suggests that many companies, these days, are in a nearly permanent state of organizational flux. A rise in efforts in Organizational Design is attributed to the accelerating pace of structural change generated by market [read more]
Do You Want to Implement Business Best Practices?
You can download in-depth presentations on 100s of management topics from the FlevyPro Library. FlevyPro is trusted and utilized by 1000s of management consultants and corporate executives.
For even more best practices available on Flevy, have a look at our top 100 lists:
- Top 100 in Strategy & Transformation
- Top 100 in Digital Transformation
- Top 100 in Operational Excellence
- Top 100 in Organization & Change
- Top 100 Management Consulting Frameworks
These best practices are of the same as those leveraged by top-tier management consulting firms, like McKinsey, BCG, Bain, and Accenture. Improve the growth and efficiency of your organization by utilizing these best practice frameworks, templates, and tools. Most were developed by seasoned executives and consultants with over 20+ years of experience.
Readers of This Article Are Interested in These Resources
70-slide PowerPoint presentation
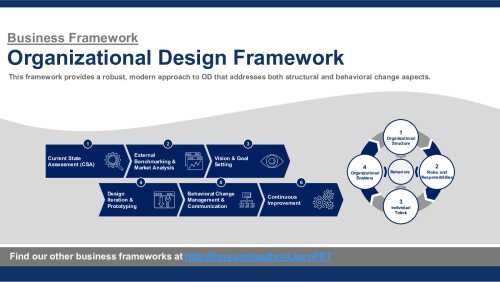
Organizational Design (OD) is a structured approach to aligning the structure, processes, and systems of an organization to achieve its strategic objectives and enhance performance. It encompasses various components, including defining the purpose of reorganization, determining supportive [read more]
|
|
145-slide PowerPoint presentation
|
|
Excel workbook
| |||
About Flevy Management Insights