One function of CRMs is their ability to perform customer analytics. Not every CRM prioritizes this feature, but many do. And if your CRM can help you perform analytics, you should definitely take advantage of it. CRM analytics is an excellent way to boost your company’s performance.
But what exactly is CRM analytics? Furthermore, why do you need them, and which customer metrics should you track? We’ll answer all three of those questions below, so just keep reading to learn more.
What is CRM analytics?
CRM analytics is a process where you use a CRM platform to analyze customer metrics based on the data the platform gathers.
The core function of CRMs is to gather data about your leads and customers. The purpose of gathering this data is to let you learn from it, so you obviously want to spend time performing CRM analysis. Fortunately, many CRM tools can automatically compile customer data into reports so you don’t have to do all the work yourself.
By looking at specific trends and types of data, you can learn about your customer base.
Why perform customer analytics?
The reason for performing CRM analytics is that, in the long run, it can help you earn far more revenue. How does that work? Well, analyzing your customers lets you learn more about them, such as which demographics most commonly buy from you and what they want from your products or services.
By learning that information, you can upgrade your products and services to better appeal to your audience. Then you can create more compelling marketing campaigns that address user interests and pain points to encourage conversions. Ultimately, that will drive more sales and earn you more revenue.
For that reason, you definitely don’t want to skimp on CRM analytics. Take the time to analyze the data you gather and learn as much as you can about your audience.
5 CRM metrics to track
We’ve established the importance of performing CRM analytics, as well as what it is. But analytics involves looking at specific metrics. So, which CRM metrics should you track?
There are countless metrics you could track, and it’s really up to you which ones you prioritize. That said, there are definitely a handful you should make sure to include. Here are five customer metrics to keep an eye on!
1. Net promoter score
Net promoter score (NPS) is a metric that measures how satisfied your customers are with your company. You can measure NPS by sending out forms where users can rate their satisfaction on a scale from 1 to 10.
On this scale, ratings of 6 or under indicate dissatisfaction. A 7 or 8 represents a neutral customer, while 9s and 10s count as promoters, or fully satisfied customers who are likely to promote your business.
By looking at your overall NPS, you can see how well you satisfy your customers. That’s crucial because if you don’t satisfy them, that’s something you’ll want to know so you can improve. You can figure out why customers are dissatisfied by simply including an additional question about it in the form.
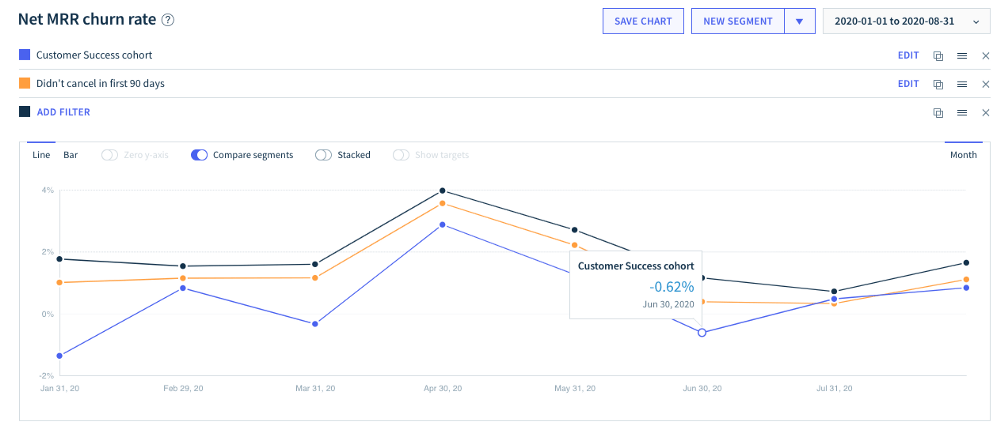
2. Customer churn
Customer churn refers to how many customers you lose within a given period. Every business loses customers from time to time. The question is, how many are you losing? Does it indicate a particular problem that your business can solve to retain more customers?
Customer churn is calculated as a percentage. To find it, just divide the total number of customers by the number that left within a given period, and then multiply by 100 to get the percentage that left. If the percentage is significantly high, it’s time to start asking what drove those customers away.
Did most of those customers leave after you made a particular change to your company? Did most of them express a similar reason for leaving? If so, you can fix that issue to prevent even more customers from leaving in the future.
3. Rate of renewal
Rate of renewal is a customer metric that measures how many of your customers continue to buy from you over time. This metric is primarily helpful if you offer a subscription-based product or service, but in theory, you could use it for anything that customers buy repeatedly and at consistent intervals.
Like customer churn, rate of renewal is calculated as a percentage. So, let’s say you offer software that requires a monthly subscription. To find the rate of renewal for a given month, you would divide your total number of customers from the previous month by the number that renewed their subscription this month, and then multiply by 100.
A low rate of renewal means there are a lot of customers who are using your product or service, but then choosing to stop using it after a certain length of time. That tells you there may be something about your product or service that’s driving users away, and you should work to figure out what that something is.
4. Customer retention cost
If you offer something that customers will want to buy more than once, you want to put in the work to retain those customers. It’s hard work to earn new customers, so once you do earn them, you want to keep them. But that still requires a marketing effort, and marketing costs money.
That’s why you can benefit from tracking customer retention cost, which is simply the amount that it costs to retain the average customer. To calculate this metric, divide your total customer retention expenses for a given time period by the number of customers you successfully retained during that period.
You may find that you’re spending vast amounts of money just to retain a single customer. If that’s the case, you may want to find ways to improve your marketing so that it either takes less effort to retain customers, or you can retain more of them for the same cost.
5. Close rate
Finally, your close rate is simply a measure of how often you convert leads into sales. To find your close rate, you can divide all possible sales opportunities in a given time period by all the ones that resulted in sales. Then multiply by 100, and voila—you have your close rate.
This metric is important for a similar reason as other CRM metrics on this list—if you have a low close rate, you need to find ways to upgrade your marketing so you can drive more sales and earn more revenue. Otherwise, you’re pouring money into marketing campaigns without getting much back.
Upgrade your CRM analytics with Nutshell
CRM analytics is vital to your company’s success. But you can’t perform CRM analytics without first having a CRM. Moreover, you should aim to get a CRM that prioritizes analytics. That’s why Nutshell is the perfect platform for you.
Nutshell offers all the standard CRM features, like sales automation and customer data organization, but it also has an entire tab dedicated solely to reports. Not only can you view basic sales reports, you can also create customized reports for just about any metric of your choosing. That makes Nutshell perfect for CRM analytics.
Want to try out Nutshell for yourself? Get started with our 14-day free trial today!