
Acquiring new users is great, but how do you keep those users so satisfied that they return to your product again and again?
That’s where product analytics comes in.
By collecting and analyzing data on how users interact with your product, you can develop a clear picture of who your users are and how you can address their needs, wants, and struggles.
Trying to grow your product based on hunches or intuition is basically a shot in the dark. Using product analytics turns the light on.
Read on to learn how you can enhance user experience (and thus product growth!) with product analytics.
What is product analytics?
Product analytics is a process in which you collect and analyze data about the ways users interact with your product.
This data is useful because it shows what users are actually doing in your product, which can reveal opportunities for product improvement:
- -Removing points of friction
- -Identifying expansion (cross-selling or upselling) opportunities
- -Identifying overlooked features
Why do you need product analytics?
Product analytics offers insight into where users gain or miss product value in ways that customer feedback alone cannot provide.
After all, users can’t give feedback on features they don’t know exist. This is not to say that customer sentiment is useless – far from it.
Rather, product usage data gives you specific, actionable information about user behavior that may be driving greater product adoption or churn. Companies that excel at analyzing product feedback are on average more customer centric than those who are not as competent.
Collecting and analyzing product usage data will provide answers to questions like:
- -Which features have the highest user engagement?
- -Which users are getting the most value from your product?
- -How can users be directed to the “AHA moment” (seeing the value of your product for the first time) more quickly and effectively?
- -Where are points of friction that may be driving churn?
What type of product analytics do you need?
Product analytics data comes in a few different flavors, centered mostly on the “what”, “who”, and “why” of user behavior. There are a number of tools well-suited to uncovering and examining each type of data, and the ones you will need depend on your goals (we’ll cover this later on).
1. Quantitative product analytics
Quantitative analytics show you the “what” of user behavior – what are they actually doing in your product? Imagine all the data you collect on every click and action the user takes inside the product.
Some tools for collecting and analyzing quantitative product analytics include Heap, Mixpanel or Amplitude.
2. Goal-based product analytics
A goal-based analysis is all about the “who” of product usage data.
This data will show you which users are engaging with your product and which ones are not. Having this data allows you to proactively identify potential churn users before they even decide to cancel their accounts.
To get at the heart of this product analytics data, check out tools like WalkMe or alternatives.
3. Qualitative product analytics
Analyzing product usage patterns helps you get at the “why” of user behavior.
This helps you understand what’s driving users’ positive or negative behaviors in your product and set about improving the user experience so that they get value from your product more effectively.
Good tools for working with qualitative analytics include Hotjar or Fullstory.
The choice of tools should be based on your goals for the data.
You may not need a tool from each category, or you may want all three. The main thing is that your tools and data need to be integrated.
It’s only when your tools communicate with each other that you can get a clear, comprehensive picture of user behavior and recognize what steps you can take to improve their experience with your product.
How can product analytics help you build better user experiences in SaaS
So why all the attention on the user interactions with your product?
Well, the user’s overall experience is based on their satisfaction with in-product interactions.
This is important to optimize since improving user onboarding experience translates to higher product adoption rates, which leads to better customer retention and ultimately higher customer lifetime value (CLV).
Product analytics lets you identify where points of friction in the user journey are hindering more robust product adoption. This, in turn, gives you specific metrics for product improvement so that you can take targeted, data-driven action.
Now let’s look at some examples of how you can use analytics to improve your metrics.
How to use product analytics to improve trial to paid conversion rate
Users are only going to pay for your product if they see value in it.
And while your product may indeed possess the value they’re looking for, the user’s journey to the “AHA moment” is largely shaped by their experience and interactions with the product.
So next, let’s see how you can bring users to the point of recognizing your product’s value using product analytics data.
1. Use data and segment your audience
Welcome screens with micro surveys are a great start.
Using data collected from short in-app surveys and during the signup flow lets you build multiple user journeys paths tailored to specific customer personas segments.
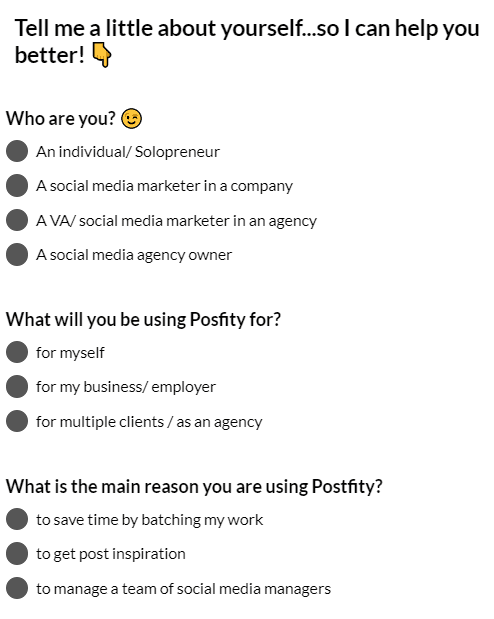
Source: Postfity app
The key is identifying the user’s job-to-be-done so that you can build differentiated user onboarding flows that direct users toward experiencing value more effectively. Experiencing value gives them a good reason to convert.
2. Build a checklist using custom events and drive users towards the activation point
In-product checklists help steer users directly toward actions that will demonstrate the product’s value. Conducting product analytics will show you which specific user actions lead to greater product adoption and conversion.
Use this data to populate your checklist custom events. For example, drive users to discover secondary features that bring more value with a short checklist.
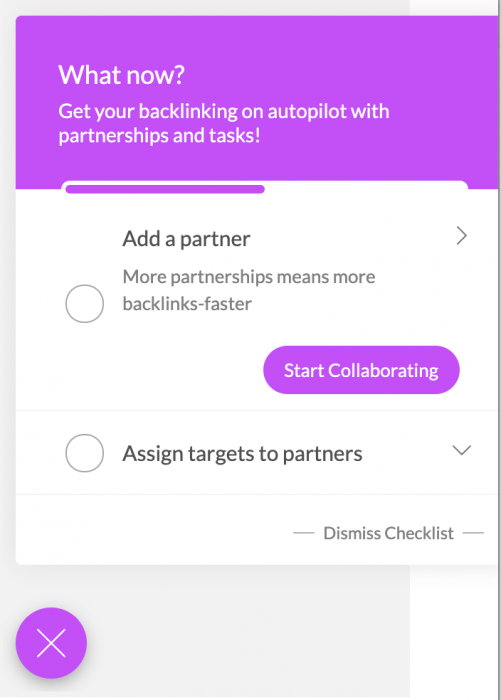
Source: BacklinkManager in-product checklist
A good strategy here is to set up a custom event checklist with a task for each key action and keep that list to a manageable minimum required to help the user experience value.
Then, have the checklist trigger regularly until all the tasks are complete.
3. How to use product analytics to increase product adoption
Product adoption occurs when user experiences repeated value during their interactions with your product, and thus is motivated to continue using it again and again.
Let’s look at a few ways that product analytics can help you motivate stronger user engagement.
4. Use data and help users discover relevant features for their use case
First, you’ll want to segment your users so that you can identify which are the most engaged. Product analytics is useful here as it shows who is doing what in your product, and how much they’re doing it.
Next, determine which features these engaged users are interacting with the most.
When comparing this with less engaged user cohorts, you’re likely to find that some features are being under-utilized or neglected altogether.
If highly engaged Customer A is using features 1, 2, and 3, but Customer B with the same job-to-be-done is only using features 1 and 2, then nudging Customer B toward discovering feature 3 will enhance the value he experiences from your product.
In-product tooltips are a good way to achieve this. Just make sure to trigger these small UI patterns to show based on customer persona or job-to-be-done, using product analytics.
You wouldn’t want to highlight features that are not relevant to some customers.

Source: Kommunicate – Tooltip announcing new features to a user cohort
5. Collect feedback and use it to improve your product
Product analytics shows you what users are doing with your product, but it doesn’t show you how they feel about it. A user may engage with a certain feature frequently but still be annoyed by how the interaction works.
Collecting user feedback is the way to discover these friction points.
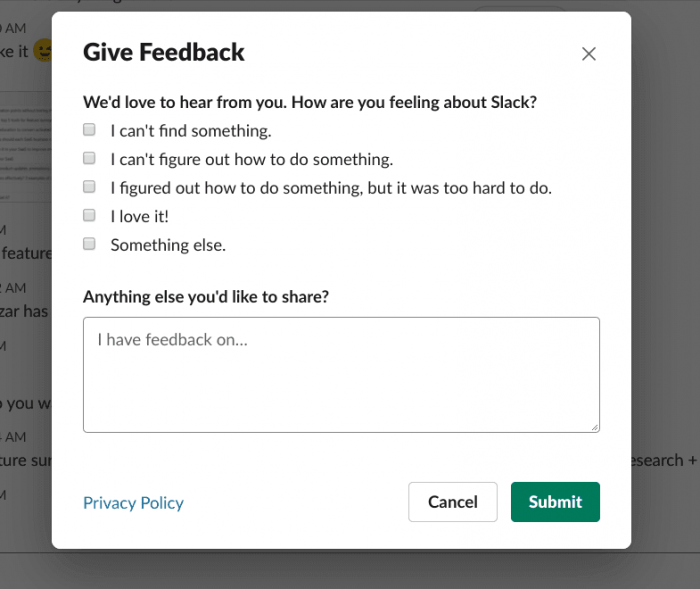
Source: Slack feedback survey
In-product micro surveys are an easy, quick way to continuously collect user sentiment on their interactions with your product.
These will give you both quantitative and qualitative data on what users value about your product and where they experience friction. Analyzing this data can help focus the results of your product analytics and take action to either remove points of friction or replicate interactions that bring value.
How to use product analytics to reduce churn
Product analytics can provide some good warning signs of potential customer churn. Getting a heads-up about users who are at risk of churning is useful because it gives you a chance to do something about it before you’ve lost the customer.
After all, less churn means higher retention, and that equals better CLV.
1. Track NPS data and proactively reach out to detractors before they churn
Net promoter score (NPS) surveys are a great way to get your finger on the pulse of customer sentiment. And you can build them in minutes using a no-code tool, and trigger them based on the product analytics data you have collected.
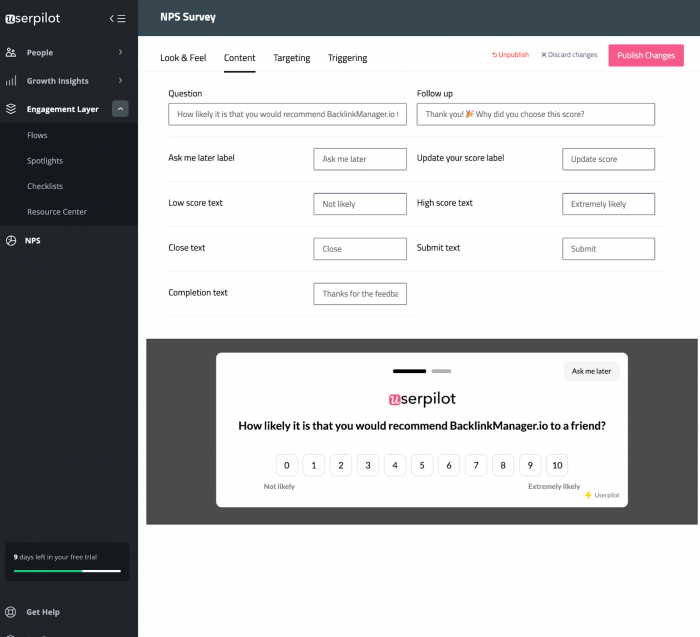
Source: NPS built with Userpilot user onboarding software
Users who respond with a low score (ie. saying that they wouldn’t recommend your product to a friend or colleague) are very likely at risk of churning.
The good news is that you can do something about it.
Once you’ve identified your NPS detractors, it’s a good idea to reach out to them to address their problems. You can do this by:
- -Sending an email that connects the user with your customer success team. This provides an opportunity for you to show the user that you care about their experience with your product and want to help them get value from it.
- -Setting up an in-product modal that lets the user know the quality of their experience is important and encourages them to set up a meeting with customer success to find solutions to points of friction.
2. Use churn surveys and offer users an alternative to canceling their account
Sometimes you’re not able to get in front of user churn. In this case, churn surveys can act as a safety net to help mitigate churn.
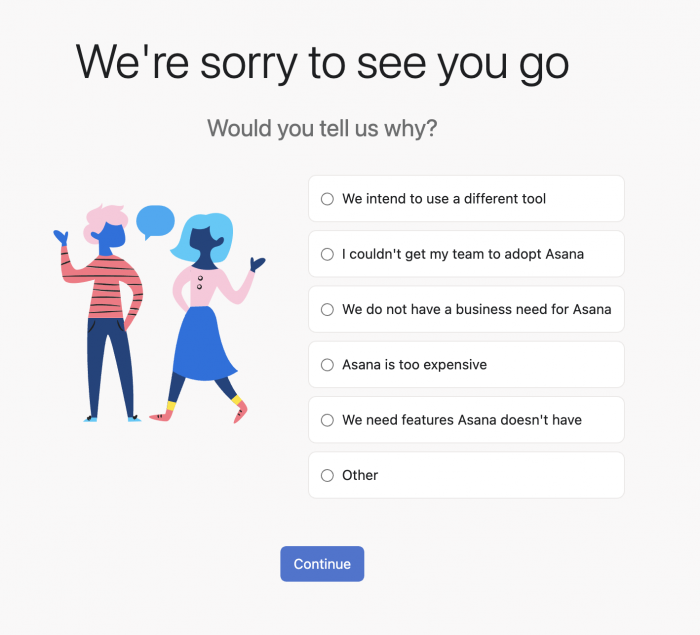
Source: Asana in-app churn survey
Churn surveys work by triggering when a user clicks the “Cancel subscription” button in your product. Typically, the survey asks for some brief feedback on why the user wants to cancel and gives an alternative to canceling, such as pausing the account rather than leaving.
In Asana’s case, if the user clicks on Asana is too expensive, they will be automatically offered an alternative to cancelling.
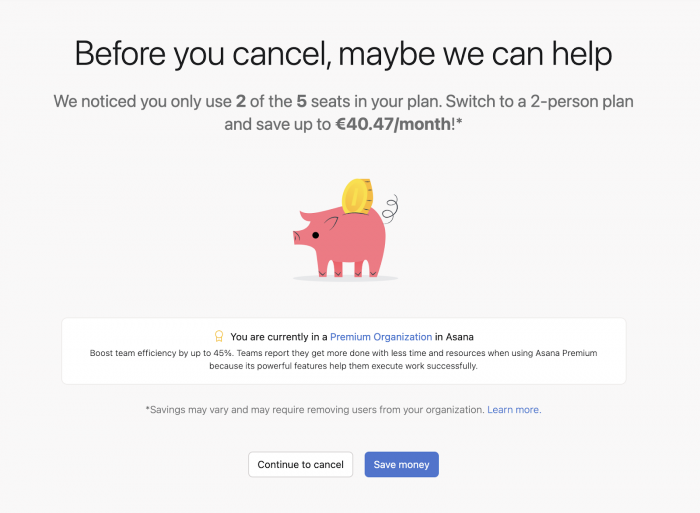
Even if the customer decides to quit, the churn survey provides you with some feedback for improvement that could prevent further churn.
What can your company gain from implementing product analytics?
As we’ve seen, understanding your users is key to improving their experience. A good experience boosts product adoption and retention, increases CLV and decreases churn.
Product analytics is a powerful tool for getting to the heart of what your users value, and how to deliver that to them more effectively.
Once you’ve grabbed the right analytics tools for your product growth goals, you’re ready to get started.


